Business Intelligence Reporting
Discover opportunities through smart and easy to understand automated reports, built specifically for your business
Work smarter, not harder
Business intelligence reporting refers to processes that pull apart data and transform them into insights and facts that allow more informed tactical decision making. Business intelligence is heavily focused on the close analysis of data and findings that then presents users with a detailed understanding of the kind of shape their business is in. Reports, graphs and charts are all used to showcase the strengths and weaknesses of a business with tangible evidence.

6 benefits to using Business Intelligence
- Collect accurate and meaningful data
- Gain powerful insights
- Save yourself time exporting, calculating and graphing your data manually
- Make more informed business decisions
- Improved sales forecasting
- Ability to refine processes
What We Do
Key business performance metrics
We collect and assess business data that allows us to paint an accurate and informative picture of your business. This picture takes the guesswork out of assessing what works and what doesn’t From this data, we recommend best practices for managing your business and determine key business performance metrics.
Business reports
Business reports allow for further evaluation of particular issues and show how to improve your operations. Having access to live, interactive business reports and dashboards lets you easily understand and analyse your sales, inventory, projects and more. We also design printed and digital reports to help you present your data to others.
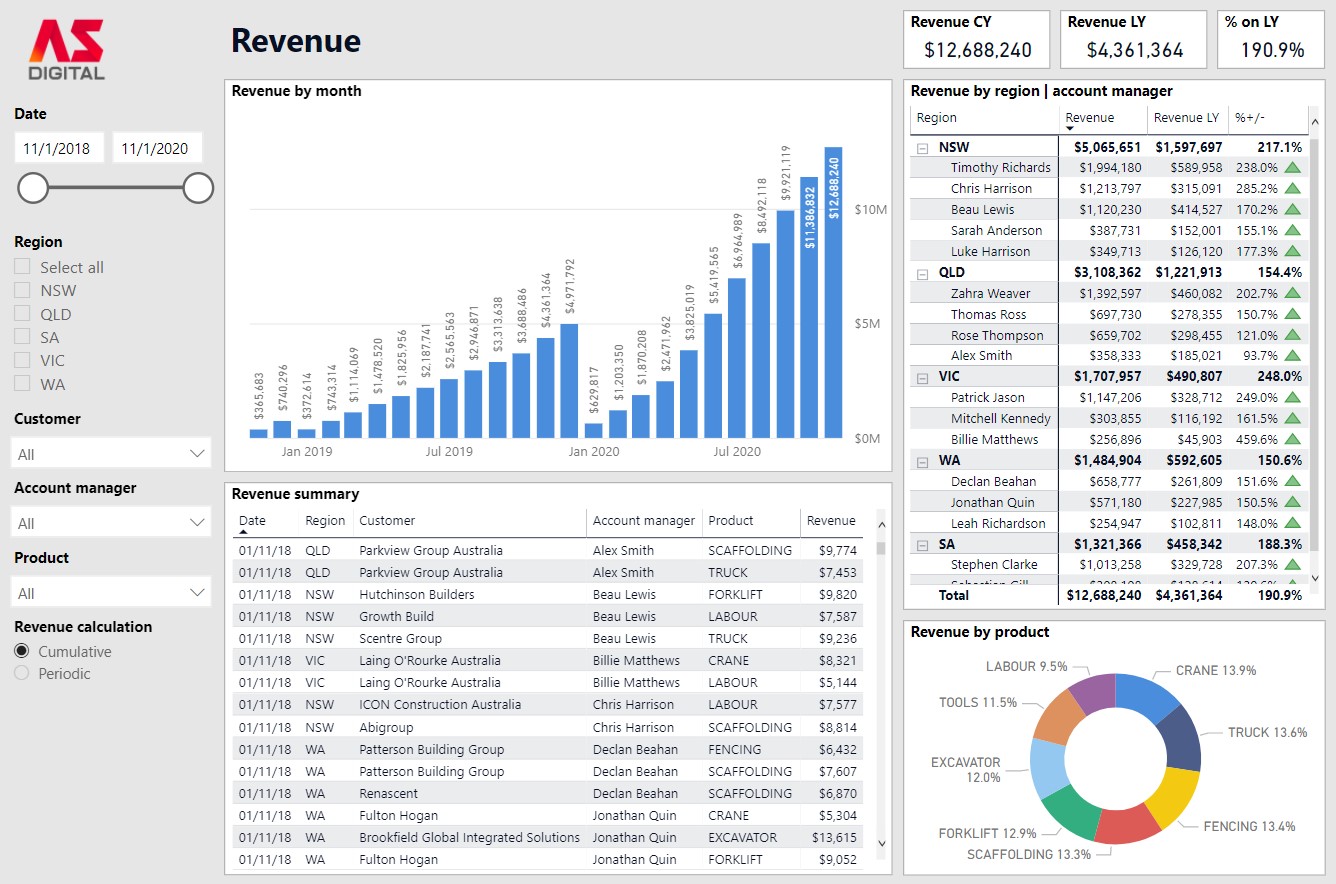
Microsoft Power BI
Microsoft Power BI is a business intelligence app used to display business data in an easily understandable way. It allows our clients to create and publish interactive and meaningful reports from a wide variety of business data, such as sales, production output, stock, projects, and more. For example, you can gain insights into specific performance areas, such as the total revenue for each region, or generated by each salesperson over a specific time period.
What They Say
Thanks for all your help it has been greatly appreciated. You have all been so patient and kind and I am beyond thrilled with what we came up with. Brief nailed!